 (1)
(1)OUCC Proceedings 11 (1983)An Estimate of the Palaeodischarge of Cueva Culiembro, Asturias, Northern Spain |
OUCC Proceedings 11 Contents |
Steven Gale
Cueva Culiembro (43° 15' 30" N, 1° 11' 50" W with reference to the Madrid meridian) is a former resurgence cave which, as a result of the incision of the Rio Cares, now lies in the side of the Cares gorge about 30 m above the present resurgence of Fuente Culiembro. The outlet to the cave is largely phreatic in form. At some stage in its development the passage was almost totally infilled by clast-supported cobble-grade fluvial deposits, although this fill has been largely removed by subsequent stream action and now remains only as a carbonate-cemented terrace on either side of the passage. In the roof of the passage can be found solutional scallops. If these can be regarded as having developed during a period when little or no sediment existed in the passage, then the scallops may be used to give an indication of discharge during the period of phreatic development of the cave. This assumption is probably not unreasonable given that the present deposits appear to represent a single sediment input which probably either choked the passage and/or was rapidly re-excavated.
The conditions under which scallops develop has been investigated by numerous
workers (see, for example, Allen, 1971; Goodchild and Ford, 1971; Blumberg and
Curl, 1974), a number of whom have demonstrated that scallop form is
hydraulically-controlled. Under conditions of uniform, steady-state flow, it
appears that scallops develop at a stable scallop Reynolds number (Re*),
where
(1)
in which
![]() =
mean boundary-shear velocity, λ = mean scallop wavelength; ρf = fluid
density; and μ = fluid dynamic viscosity. Published estimates of mean Re*
range between 1000 and 3180 (Blumberg and Curl, 1974, 742; Thomas, 1979; Gale,
1984, Hsu et al., 1979), and all these values fall within the expected
laminar-turbulent transition phase of ca. 1000-3000. Consequently, Blumberg and
Curl's (1974, 742) estimate of Re* = 2220 will be used in subsequent
calculations, since this lies approximately in the middle of the
laminar-turbulent transition range, and since it is perhaps the most reliable
estimate of the stable value of Re*
.
=
mean boundary-shear velocity, λ = mean scallop wavelength; ρf = fluid
density; and μ = fluid dynamic viscosity. Published estimates of mean Re*
range between 1000 and 3180 (Blumberg and Curl, 1974, 742; Thomas, 1979; Gale,
1984, Hsu et al., 1979), and all these values fall within the expected
laminar-turbulent transition phase of ca. 1000-3000. Consequently, Blumberg and
Curl's (1974, 742) estimate of Re* = 2220 will be used in subsequent
calculations, since this lies approximately in the middle of the
laminar-turbulent transition range, and since it is perhaps the most reliable
estimate of the stable value of Re*
.
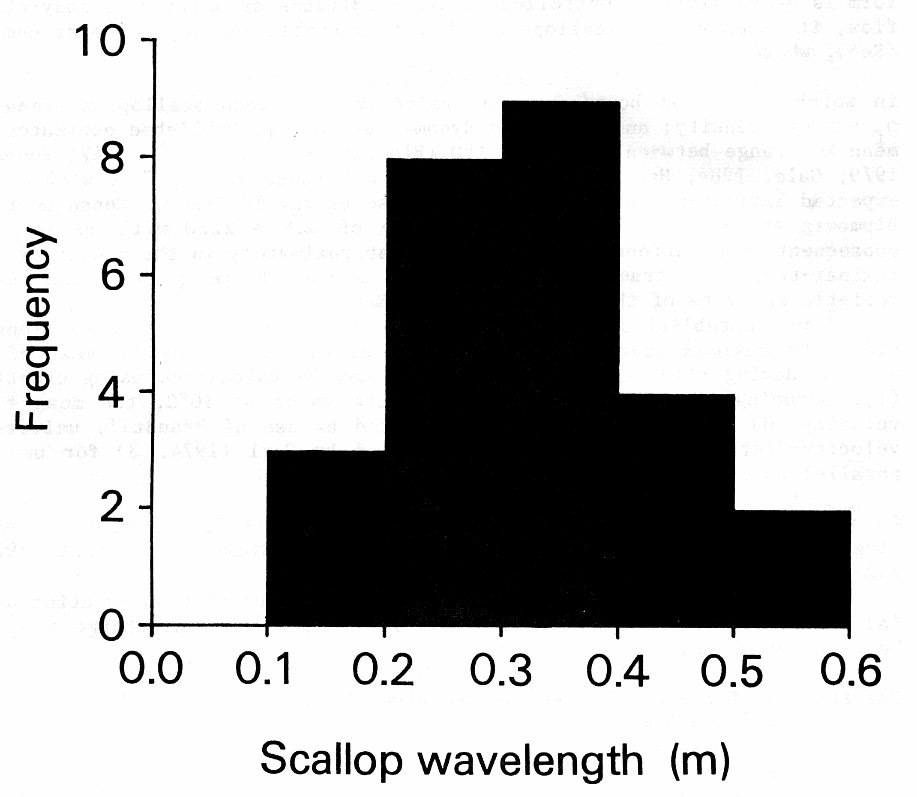
![]() was
established in Cueva Culiembro by measuring scallop wavelength along the maximum
length in a streamwise direction, taking the mean of 26 values. Having obtained
was
established in Cueva Culiembro by measuring scallop wavelength along the maximum
length in a streamwise direction, taking the mean of 26 values. Having obtained
![]() ,
from which
,
from which
![]() may
be calculated using equation (1), assuming the conduit fluid to be pure water at
10°C,
the mean flow velocity (
may
be calculated using equation (1), assuming the conduit fluid to be pure water at
10°C,
the mean flow velocity (
![]() )
in the conduit may be computed by use of Prandtl's universal
velocity-distribution equation (as modified by Curl (1974, 3) for use in
parallel-walled conduits):
)
in the conduit may be computed by use of Prandtl's universal
velocity-distribution equation (as modified by Curl (1974, 3) for use in
parallel-walled conduits):
 (2)
(2)
in which d = distance between conduit walls; and BL =
Prandtl's bed-roughness constant =9.4 for scalloped surfaces (Blumberg and Curl,
1974, 742-744).
Having obtained
![]() ,
and having estimated the conduit cross-section area (a) at the point of
measurement to be 15.3 m2, conduit discharge (Q) may be calculated
from:
,
and having estimated the conduit cross-section area (a) at the point of
measurement to be 15.3 m2, conduit discharge (Q) may be calculated
from:
 (3)
(3)
The results of these calculations are given below:
![]() =
0.325 m (s
= 0.1074 m)
=
0.325 m (s
= 0.1074 m)
n = 26
a = 15.3 m2
![]() =
8.9x10~3 m s-1
=
8.9x10~3 m s-1
![]() =
9.4x10⁻² m s-1
=
9.4x10⁻² m s-1
Q = 1.4 ms-1
The estimated discharge is of the expected order of magnitude and may be
compared with the measured discharge of 0.7 m3 s-1 under
low-flow conditions at the modern analogue of the cave, Fuente Culiembro.